How To Save Energy Using IoT
 By Rebekka Biegel
We once asked a major data management company that works with BigData from social media and business execution how they approach IoT. The answer was
We don’t, IoT is a buzz work. Everybody talks about it and nobody knows what value to get out of it.
Obviously, we know that there is value to be captured from installing sensors and controllers for larger chilled water systems since we offer Cooling as a Service.
There are things you can do yourself.
Our general advice is to start very small, be clear on what data you need and what you want to use it for before starting to measure, monitor and analyze.
When you are clear on the target, measuring and monitoring can be adequate tools to understand the improvement potential, tune systems and document the outcome.
Here are a few ideas to get started in a cooling system:
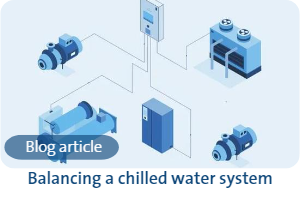
- Balance the pumps in a pump header
- Check pump size and savings potential by replacement based on the operation
- Check if the system suffering from over pumping
- Check that pump flow is not higher or lower than specified for the chiller
- Ensure the condenser tubes are clean and show no signs of fouling
- Ensure equipment are turned off when not in operation
- Shift operation of the chilled water system towards periods with lower electricity cost
Data analysis
Getting the data in good shape for your need holds a few pit falls. Being systematic is key to avoid them.

Some or all the data might already be logged and stored in the BMS or CTS system. Our experience is that it can be a bit tedious to get the data out of those systems and on a format where the relevant parameters can be correlated.
We have been using Microsoft PowerBI for that job. When the time series get too long, Spread Sheets break down. The best data has unique identifiers so columns with different parameters can be perfectly matched. When this is not the case you will have to do some wrangling of the data to get to corresponding values of e.g. temperature and power consumptions over time.
Start logging data
It might be easier to start over with a data logger. There are solutions that store the data locally and solutions that store in the cloud. In Grundfos we have been using a solution with clamp on power sensors and a data bridge with a SIM card when we want to start as simple as possible.
In research it is important to be able to repeat an experiment and reproduce the data. To be able to use previous data to compare to researchers use the FAIR framework. We are not doing research here, but the basic thinking is useful.
Data quality
For data to be useful it must be Findable, Accessible, Interoperable and Reusable.

You might have found the data you need on the BMS dashboard but cannot access it as an exported timeseries.
The timestamps in two files might not be correlated and therefor they are not interoperable.
When you don’t know if the sensors were calibrated or the meaning of the headers of data columns, the data is not reusable.
Christian Rasmussen, Head of Technology, Cooling as a Service by Grundfos
Latest insights

Learn more about Grundfos Cooling as a Service
About Grundfos
A world leader in water and energy efficiency, we believe that the world is full of problems that can be solved in a better way.